Coloring an inside barThis script colors the candles covered in the previous candle. The candle is colored. You can make many adjustments yourself.
ابحث في النصوص البرمجية عن "inside bar"

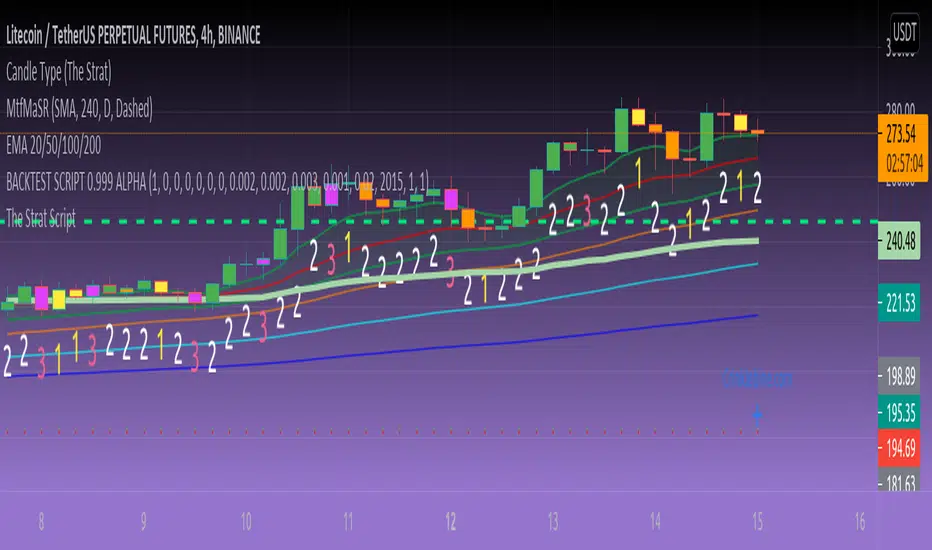
3-1-2 Strat Combo by NaturalBelleThe 3-1-2 Strat Combo by NaturalBelle automatically detects and highlights one of The Strat’s most powerful reversal patterns — the 3-1-2 setup.
When a 3 (outside bar) is followed by a 1 (inside bar) and then a 2 that breaks direction, this script plots yellow triangles and draws yellow box zones across the sequence, giving traders a clean visual cue for potential reversals or continuations.
Features:
Highlights both bullish (3-1-2-Up) and bearish (3-1-2-Down) sequences
Draws yellow boxes covering the 3-1-2 structure for easy zone recognition
Optional text labels for clarity
Adjustable box extension and transparency
Built-in alert conditions for both up and down setups
This clean, no-clutter version focuses purely on price action — no indicators, no noise. Just the pattern.
🟡 Best used on: Any timeframe
🟡 Strategy: Combine with market structure, EMAs, or supply & demand zones for confirmation
Created by NaturalBelle — keeping Strat analysis simple, visual, and precise.

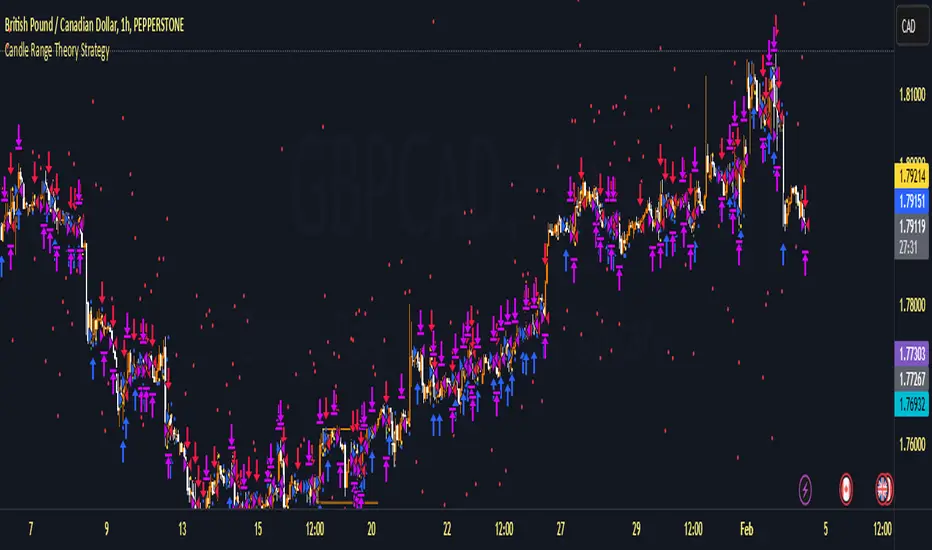
Candle Range Theory StrategyCandle Range Theory StrategyCandle Range Theory Strategy delves into the intricacies of price action analysis, focusing on the behavior of candlestick patterns within specific ranges. Traders employing this strategy aim to identify key support and resistance levels by analyzing the high and low points of significant candlesticks. The core principle lies in understanding that the range of a candle—defined by its opening, closing, high, and low prices—provides valuable insight into market sentiment and potential future movements.
To implement the Candle Range Theory Strategy effectively, one must first recognize the importance of different candle sizes. A long-bodied candle suggests strong momentum, pointing to a bullish or bearish bias, while a small-bodied candle indicates indecision or consolidation, often signaling potential reversals or breakouts. By plotting these candlesticks over a defined time frame, traders can ascertain whether the market is trending or range-bound.
Additionally, traders should consider the context in which these candles form. Analysis of the preceding price action can reveal whether current ranges are extensions of existing trends or indications of market fatigue. In particular, look for patterns such as engulfing candles, pin bars, or inside bars, as they often foreshadow forthcoming price fluctuations.
Moreover, combining the Candle Range Theory with other technical indicators, like moving averages or Fibonacci retracements, can offer a more comprehensive view of potential entry and exit points. By aligning candle patterns with broader market dynamics, traders can optimize their strategies, enhancing their probability of success while minimizing risk.
Lastly, maintaining a disciplined approach is crucial. Setting precise stop-loss and take-profit levels grounded in candle ranges can safeguard one's capital. Adhering to this framework allows traders to navigate the complexities of the market with greater confidence, ultimately leading to more informed and successful trading decisions. Embracing the nuances of Candle Range Theory not only sharpens analytical skills but also enriches one’s trading repertoire, paving the way for sustained profitability in the dynamic world of forex and equities.
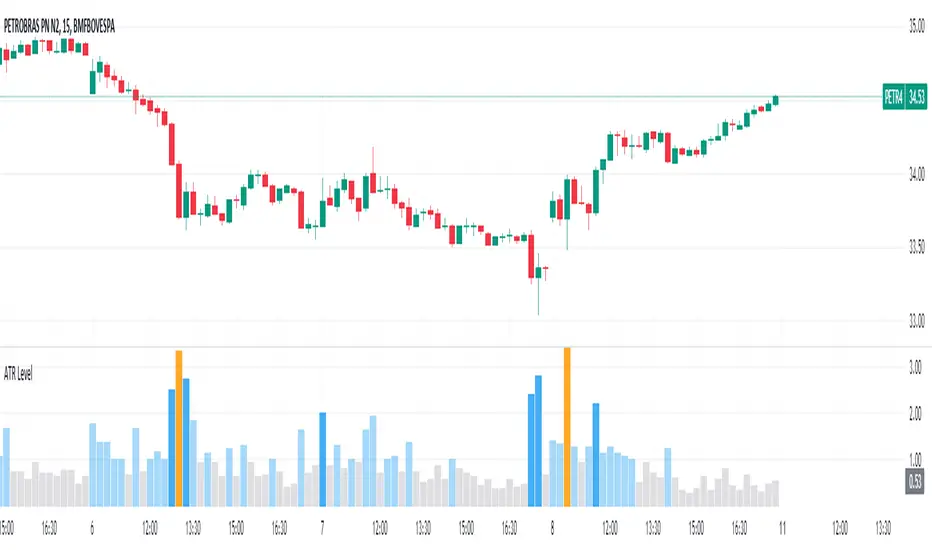
Average True Range Level█ Overview
The indicator uses color-coded columns to represent different levels of normalized ATR, helping traders identify periods of high or low volatility.
█ Calculations
The normalization process involves dividing the current True Range by the Average True Range. The formula for normalized ATR in the code is:
nAtr = nz(barRange/atr)
█ How To Use
Level < 1
During periods when the normalized ATR is less than 1, suggesting a lower level of volatility, traders may explore inside bar strategies. These strategies focus on trading within the range of the previous bar, aiming to capitalize on potential breakout opportunities.
Level between 1 and 3
In instances where the normalized ATR falls between 1 and 3, indicating moderate volatility, a pullback strategy may be considered. Traders look for temporary corrections against the prevailing trend, entering positions in anticipation of the trend's resumption
Level between 2 and 3
Within the range of normalized ATR between 2 and 3, signifying a balanced level of volatility, traders might explore breakout strategies. These strategies involve identifying potential breakout levels using support and resistance or other indicators and entering trades in the direction of the breakout.
Level > 3
When the normalized ATR exceeds 3, signaling high volatility, traders should approach with caution. While not ideal for typical mean reversion strategies, this condition may indicate that the price has become overextended. Traders might wait for subsequent candles, observing a normalized ATR between 2 and 3, to consider mean reversion opportunities after potential overpricing during the high volatility period.
* Note: These strategies are suggestions and may not be suitable for all trading scenarios. Traders should exercise discretion, conduct their own analysis, and adapt strategies based on individual preferences and risk tolerance.
Strat + HL and LH counterStrat (i = inside bar, O = outside bar) plus lower high and higher low counter.

Price ActionThis script is an alternative version of ChrisMoody's Price Action indicator, which is quite useful.
However, I found it a little intrusive with all the colors. I wanted something more subtle, so I made this.
The only difference is that this one uses shapes to highlight the candlestick patterns, and I dropped the Inside Bar indicator for simplicity.

Structure + MTF + Failed 2U/2D + PDH/PDL Sweeps (Toolkit)How this behaves (so you are not guessing)
1) Liquidity sweeps (PDH/PDL)
PDH Sweep: price trades above yesterday’s high, then (by default) closes back below PDH
PDL Sweep: price trades below yesterday’s low, then closes back above PDL
You can allow wick-only sweeps via the input if you want more signals (and more noise, because humans love noise).
2) Failed 2U / Failed 2D
Failed 2U: candle takes prior high but closes back below it (failure)
Failed 2D: candle takes prior low but closes back above it
If you enable confirmation, the script triggers the “confirmed” entry only when the next candle breaks the fail candle in the intended direction.
3) FTFC strength meter (0–3)
Uses 3 higher timeframes you pick (defaults 15, 60, 240).
Strength = how many of those TF candles are bullish or bearish.
“Aligned” means 2 or 3 agree.
4) Consolidation filter
Flags consolidation when:
You have an inside-bar streak (default 2+) and/or
ATR is compressed vs its own SMA (default threshold 0.80)
Then it can block entries if you enable “Avoid entries during consolidation”.
5) “Setup Ready” alert
Triggers before entries when:
Sweep/rejection context exists (PDH/PDL)
Structure signal is forming (failed or reversal pattern)
Consolidation filter allows it
That’s your “stop chasing every candle” mechanism.

furs ENG, Pinbar, IBF + HTFThis script will detect 3 types of patterns:
- Engufing Candles
- Pinbars
- Inside Bar Failures
It will also report whether any of the patterns are currently happening on HTF (previous candle - hence you will know whether previous day or week was engulfing, for example, and take action on it)


ETH 1-2-3 Rigor Strategy Entry & 2:1 Risk-Rewar- By: Labaxuria Descrição em Inglês (Copy & Paste):
This script is a technical analysis tool designed specifically for ETH/USDT on Daily (1D) and Weekly (1W) timeframes. It identifies the classic 1-2-3 reversal pattern to provide high-probability entry points with a strictly disciplined risk management approach.
Core Features:
C3 Trigger Identification: The indicator highlights the "Candle 3" (Confirmation Candle) where the breakout of "Point 2" occurs, validating the market structure shift.
Automated 2:1 Risk-Reward: Upon a BUY or SELL signal, the script automatically plots a Red Line (Stop Loss) at the recent pivot and a Green Line (Take Profit) at a fixed 2:1 ratio. This ensures that every win is twice the size of a potential loss.
Trend Filtering (Gray Line): It includes a 20-period Moving Average to ensure trades are aligned with the prevailing market momentum.
Compression Detection (White Candles): Identifies "Inside Bars" by coloring the candle body or borders white. This warns the trader of price compression and potential volatility buildup before a breakout.
How to Use:
BUY + C3: Enter long when the price closes above Point 2, ideally while trading above the gray 20-SMA.
SELL + C3: Enter short when the price closes below Point 2, ideally while trading below the gray 20-SMA.
Exit Strategy: Follow the plotted levels strictly. Exit at the red line to protect capital or at the green line to book profits.

Monks - SessionsScript that shows the sessions of the market by coloring the candles of each market session as defined by the user. It also shows inside bars, a timer on the left of the screen, it shows if the previous high time frame candle has been gained (1D,1W or 1M). It also shows the days of the week as vertical lines
Price Action Patterns DetectorIt's something like "Price Action Candlestick Pattern Detector." That is, it's an indicator that detects not only Pinbars and Engulfing but also all popular candlesticks in Price Action (Doji, Hammer, Shooting Star, Inside Bar, etc.)

SCoLibraryAmsterdamLibrary "SCoLibraryAmsterdam"
This library contains functions to check Amsterdam strategy price events
calcTrendMom(FilterTrendWithMa50, FilterTrendWithMa200)
This function define the current trend and momentum force according to 4wma, 12wma, 21ema and 200sma
Parameters:
FilterTrendWithMa50 (bool) : is set to true will filter trend result with 50sma
FilterTrendWithMa200 (bool) : is set to true will filter trend result with 200sma
Returns: Return a positive value if trend is up (2 : strong momentum, 1 : weak momentum) and a negative value if trend is negative (-2 : strong momentum, -1 : weak momentum)
calcPriceAmstNodeMa01(close, AtrPeriod, AtrMultiplier)
This function checks if close, 4wma and 12wma are in contraction within a multiple of the average true range
Parameters:
close (float)
AtrPeriod (simple int) : is the period used to calculate the average true range (ATR)
AtrMultiplier (float) : is the multiplier of the average true range
Returns: Return true or false
calcPriceAmstNodeMa123(close, AtrPeriod, AtrMultiplier)
This function checks if close, 12wma, 21ema and 50sma are in contraction within a multiple of the average true range
Parameters:
close (float)
AtrPeriod (simple int) : is the period used to calculate the average true range (ATR)
AtrMultiplier (float) : is the multiplier of the average true range
Returns: Return true or false
calcPriceInsidebar()
This function checks inside bar candle configuration
Returns: true or false
calcPrice12wmaExtended(close, PeriodNormalization, ExtensionPercent)
This function checks if close is over extended from the 12wma by a multiple of the average true range
Parameters:
close (float)
PeriodNormalization (int)
ExtensionPercent (float)
Returns: Return true or false
calcPrice21emaExtended(close, PeriodNormalization, ExtensionPercent)
This function checks if close is over extended from the 21ema by a multiple of the average true range
Parameters:
close (float)
PeriodNormalization (int)
ExtensionPercent (float)
Returns: Return true or false
calcPrice50smaExtended(close, PeriodNormalization, ExtensionPercent)
This function checks if close is over extended from the 50sma by a multiple of the average true range
Parameters:
close (float)
PeriodNormalization (int)
ExtensionPercent (float)
Returns: Return true or false
calcPrice200smaExtended(close, PeriodNormalization, ExtensionPercent)
This function checks if close is over extended from the 200sma by a multiple of the average true range
Parameters:
close (float)
PeriodNormalization (int)
ExtensionPercent (float)
Returns: Return true or false
calcPriceClimax(close, AtrPeriod, MovingAvgAtrMulti, VolAtrMulti)
This function checks if price is in climax evolution by comparing the extension between 4wma and 12wma, and a multiple of the average true range
Parameters:
close (float)
AtrPeriod (simple int) : is the average true range period
MovingAvgAtrMulti (float) : is the extension ratio
VolAtrMulti (float) : is the volume extension relative to the 21sma volume
Returns: Return true or false
Merged Conditional Horizontal Lines with TogglesThe ranges that have blue highs & orange lows have been broken out of & may get re-tested as "support".
Prefer this candle range to be an expansion with neutral wicks.
The ranges that have red highs and green lows have generated interest (inside-bars) in the market, where the first end will get turtle souped and the second will be the draw on liquidity.
Prefer this candle range has long wick(s).
This patch allows you to toggle either range off.

Bollinger Bands Modified (Stormer)This strategy is based and shown by trader and investor Alexandre Wolwacz "Stormer".
Overview
The strategy uses two indicators Bollinger Bands and EMA (optional for EMA).
Calculates Bollinger Bands, EMA, highest high, and lowest low values based on the input parameters, evaluating the conditions to determine potential long and short entry signals.
The conditions include checks for crossovers and crossunders of the price with the upper and lower Bollinger Bands, as well as the position of the price relative to the EMA.
The script also incorporates the option to add an inside bar pattern check for additional information.
Entry Position
Long Position:
Price cross over the superior band of bollinger bands.
The EMA is used to add support for trend analysis, it is an optional input, when used, it checks if price is above EMA.
Short Position:
Price cross under the inferior band of bollinger bands.
The EMA is used to add support for trend analysis, it is an optional input, when used, it checks if price is under EMA.
Risk Management
Stop Loss:
The stop loss is calculated based on the input highest high (for short position) and lowest low (for long position).
It gets the length based on the input from the last candles to set which is the highest high and which is the lowest low.
Take Profit:
According to the author, the profit target should be at least 1:1.6 the risk, so to have the strategy mathematically positive.
The profit target is configured input, can be increased or decreased.
It calculates the take profit based on the price of the stop loss with the profit target input.

Evolution Fractals with IBA standard fractal high has two lower high (or equal high) candles to its left and right.
For standard fractal low fractals this is vice versa.
-But this indicator plots has the option to plot standard fractals only after candle close is confirmed.
So if the current candle is still forming in live markets, only after this candle has fully closed, then the indicator checks if the fractal is valid and then plotted.
You can select this option On or Off
(with the standard fractal indicator there is a fractal plotted, but when this candle high (or low ) is broken again, the fractal disappears. This re-painting of fractals can cause confusion.
-Added an alert functionality.
When setting an alert on your chart, you can select this indicator to alert you upon the forming of a new fractal high or low.
-Added optional Inside Bar function.
When a candle High/Low does not breach the previous candle High/Low, then a different body color can be shown.
This is particular handy to quickly if this high/low is breached, without having to zoom in on the chart.

[Pt] TICK + Heikin Ashi RSI IndicatorThis indicator combines NYSE TICK and RSI to aim to provide a view of NYSE market trend strength.
What is TICK
NYSE TICK, also known as the TICK index, is a technical analysis indicator that shows the number of stocks on the New York Stock Exchange (NYSE) that are trading on an uptick or a downtick in a particular period of time. The TICK index is calculated by subtracting the number of stocks trading on a downtick from the number of stocks trading on an uptick. A reading of +1000 on the TICK index, for example, would indicate that there are 1000 more stocks trading on an uptick than on a downtick. The TICK index is often used as a measure of market sentiment, as it can provide insight into whether there is more buying or selling pressure in the market at a given time. A high TICK index reading may suggest that there is strong buying pressure, while a low TICK index reading may indicate that there is more selling pressure in the market.
By default, I am using -800 and 800 for oversold and overbought levels. These are configurable. Also, this indicator includes TICK divergence signals.
The TICK index is usually very volatile, so this indicator is best suited for lower timeframes, such as 1 to 5 min charts.
Idea of TICK neutral zone
As part of this indicator I've identified what I consider as "neutral" range for the TICK. Based on my own personal experience, the market tends to be in consolidation or choppy in this range. By default, I've defined this range to be -200 to 200. This range is configurable.
Signals
In combination with RSI and Heikin Ashi RSI (HARSI), which help smooths out the RSI values and make it easier to identify trends and potential reversal points, this indicator aims to generate Bullish vs Bearish signals based on the following conditions:
- bullish / bearish HARSI candle
- Inside bar on HARSI candle
- TICK trend (above or below Neutral zone)
- RSI trend (above or below 0, but not overbought or oversold)
- RSI / HARSI convergence and divergence
When all bullish conditions are met, the signal turns bright green. Bright red when all bearish conditions are met. These generated signals aims to provide users easy to read visual cues to help with their trades.
A table is also provided in attempt to identify the trend in real time:
TICK trend:
- Bullish, Extended
- Bullish
- Neutral w/ Bullish bias
- Neutral w/ Bearish bias
- Bearish
- Bearish, Extended
RSI:
- Bullish
- Bearish
Note on scale
This indicator is based on the scale for TICK, hence the RSI and HARSI are scaled. By default, standard overbought RSI value of 70 = 800 on this scale, whereas oversold value of 30 = -800.
Credits:
Heikin Ashi RSI code was borrowed from @JayRogers - Heikin Ashi RSI Oscillator


J2S Backtest: 123-Stormer StrategyThis backtest presents the 123-Stormer strategy created by trader Alexandre Wolwacz "Stormer". The strategy is advocates and shared by the trader through his YouTube channel without restrictions.
Note :
This is not an investment recommendation. The purpose of this study is only to share knowledge with the community on tradingview.
What is the purpose of the strategy?
The strategy is to buy the 123-Stormer pattern at the bottom of an uptrend and sell the 123-Stormer pattern at the top of a downtrend, aiming for a short stop for a long profit target.
To which timeframe of a chart is it applicable to?
Recommended for weekly and daily charts, as the signals are more reliable, being that strategy a good option for swing and position trading.
What about risk management and success rate?
The profit target is established by the author as being twice the risk assumed. Also according to the author, the strategy is mathematically positive, reaching around 65% of success rate in tradings.
How are the trends identified in this strategy?
Two averages are plotted to indicate the trend, a fast EMA average with an 8-week close and a slow EMA average with an 80-week close.
Uptrend happens whenever the fast EMA is above the slow EMA and prices are above the fast EMA. In this case, we should start looking for a LONG entry based on the signal of the 123-Stromer pattern to buying.
On the other hand, downtrend happens when the fast EMA is below the slow EMA and prices are below the fast EMA. In this case, we should start looking for a SHORT entry based on the signal of the 123-Stromer pattern to selling.
How to identify the 123-Stormer pattern for a LONG entry?
This pattern consists of three candles. The first candle has a higher low than the second candle's low, and the third candle has a higher low than the second candle's low. In this pattern, we will buy as soon as a trade occurs above the third candle's high, placing a stop as soon as a trade occurs below the second candle's low, with profit target twice the risk assumed. In another words, the amplitude of the prices of the three candles from the third candle’s high upwards. (you can use fibonacci extension to determine your stops and profit targets).
Importantly, the low of the three candles must be above the fast EMA average and in an uptrend.
How to identify the 123-Stormer pattern for a SHORT entry?
This pattern consists of three candles. The first candle has a lower high than the second candle's high, and the third candle has a lower high than the second candle's high. In this pattern, we will sell as soon as a trade occurs below the third candle's low, placing a stop as soon as a trade occurs above the second candle's high, with profit target twice the risk assumed. In other words, the amplitude of prices of the three candles from the third candle’s low down (you can use fibonacci extension to determine your stops and profit targets).
Importantly, the high of the three candles must be below the fast average and in a downtrend.
Tips and tricks
According to the author, the best signal for both LONG or SHORT entry is when the third candle is a inside bar of second candle.
Backtest features
Backtest parameters are fully customizable. The user chooses to validate only LONG or SHORT entries, or both. It is also possible to determine the specific time period for running the backtests, as well as setting a threshold in candels for entry by the 123-Stormer pattern.
Furthermore, for validation purposes, you can choose to activate the best signal of the pattern recommended by the author of the strategy, as well as change the values of the EMA averages or even deactivate them.
Final message
Feel free to provide me with any improvement suggestions for the backtest script. Bear in mind, feel free to use the ideas in my script in your studies.

Narrow Range (NR) IndicatorNarrow Range (NR) trading strategy is a breakout-based method that assumes that the price of security trends up or down after a brief consolidation in a narrow range. This indicator can plot:
1. Narrow Range (NR) 4, 7, and 21
2. Narrow Range (NR) 4, 7, and 21 + Inside Bars (IB)
NR 4/NR 7/NR 21 day acts as a confirming factor on where the price will move further. Breakout of NR 4/NR 7/NR 21 candle with high volumes indicates bullishness, while the breakdown candle indicates bearishness.

Common Candlestick PatternsCommon Candlestick Patters Highlighter.
- TLS: Three Line Strike (Bearish and Bullish)
- AB: Advance Block
- IB: Inside Bar
